
Statistics
The at-a-glance numbers: occupancy, guests over time and guest ratings.
Statistics is the short answer to how are we doing. Where reports give you rows you can export, Statistics gives you a handful of numbers and charts meant to be read in a few seconds.
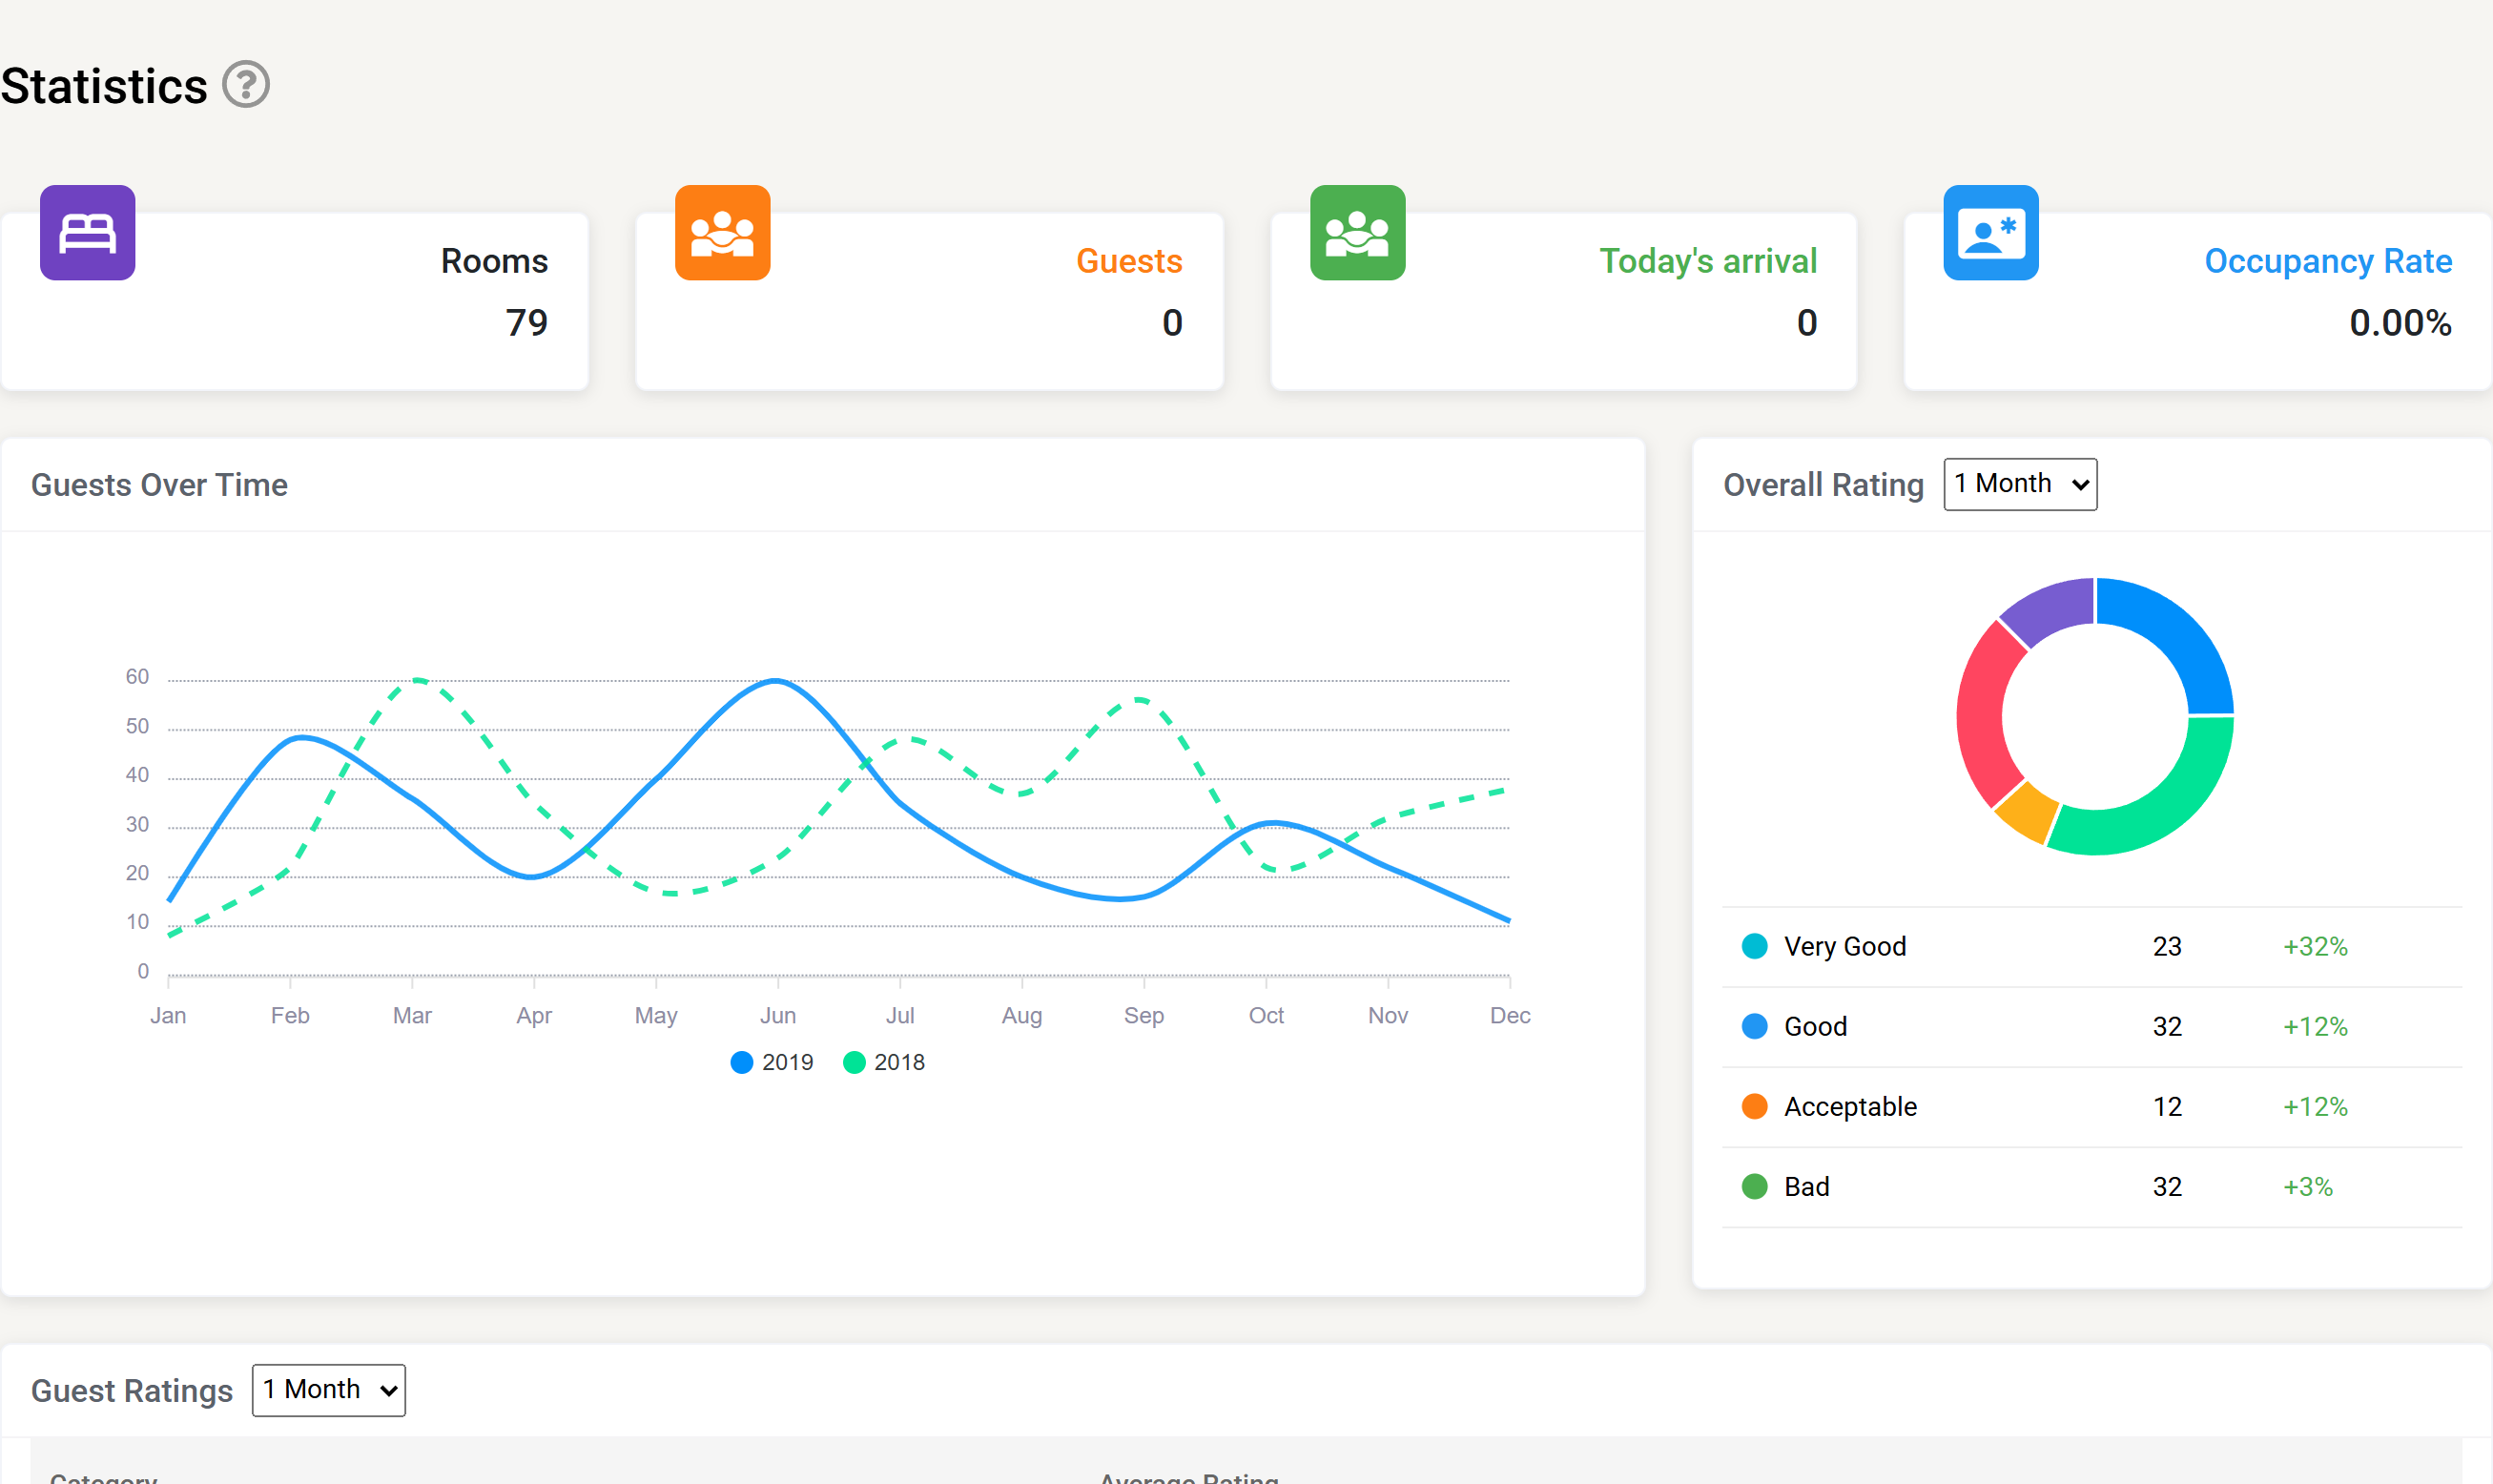
What each control does
- The 1 Month dropdown above Overall Rating, and the one above Guest Ratings, change the period those two panels cover. They are independent of each other.
- Guests Over Time plots two years against each other — the current year as a solid line, the year before as a dashed one — so the shape of the season is comparable rather than just the total.
- The Overall Rating donut breaks scores into Very Good, Good, Acceptable and Bad, each with its count and the change against the previous period.
Nothing on this page is editable and nothing exports; it is a read-only summary. For numbers you can download, use Reports.
The cards
| Card | What it counts |
|---|---|
| Guests | How many guests are in house. |
| Rooms | Rooms in the property. |
| Occupancy rate | The proportion of rooms occupied. |
| Today’s arrivals | Guests due in today. |
These are live — they follow check-ins and check-outs as they happen during the day.
Guests over time
A chart of guest numbers, viewable by month or by year. Use it for the shape of the season rather than for exact figures: it is the trend that is informative, and the pattern of last year is the best guide to this one.
For precise occupancy figures over a chosen period, use the Occupancy reports instead.
Guest ratings
- Overall rating and average rating across everything guests have scored.
- A breakdown by category, so you can see whether the complaint is about cleanliness, the breakfast, or the welcome.
- Scores are grouped as bad, acceptable, good and very good.
Ratings come from guests through the guest app. The detail behind these numbers — individual comments and scores — is in Guest ratings and Rating reports.